Now hiring!
eth_getLogs is one of the most heavily used remote procedure call (RPC) methods in Ethereum infrastructure. RPC methods are the standard way applications query data from an Ethereum node, such as retrieving transaction or event information. eth_getLogs is how wallets reconstruct transaction history, how block explorers index events, and how downstream systems extract meaning from raw blockchain data.
At small ranges, it works well enough. At large ranges, it does not.
Once queries span around 100,000 blocks, they risk timing out under default client settings. Queries that scan millions of blocks typically require extended timeouts and can take minutes to complete. For teams that depend on historical event data, this is not a theoretical limitation. It is a recurring operational problem.
Log Index exists to address that problem directly.
A wallet application queries the full chain for ERC-20 transfer events involving a typical user address, where relevant events are sparse across the chain. This is how wallets reconstruct transaction history.
Under default client settings, this query risks timing out once it spans large portions of the chain. When timeouts are explicitly disabled or extended to allow the query to complete, execution can take more than 15 minutes.
With Log Index enabled, the same query completes in about 1 second.
Log Index is an internal capability in the Nethermind client designed to improve the performance of large-scale eth_getLogs queries.
At a high level, Log Index introduces an additional database layer dedicated to EVM logs.Instead of scanning every block in a large range, the client uses indexed address and topic data to identify a much smaller sequence of relevant blocks to scan, with a rate of false positives far lower than with the bloom filters.
This does not change how developers interact with the client. There is no need to integrate new RPC methods or modify existing calls. Existing eth_getLogs calls behave the same way, but return results much faster once Log Index is enabled.
It is not a new tool and not a user-facing feature. It is an architectural improvement to something teams already rely on.
No. Log Index does not introduce a new RPC method or a new way of querying logs. Developers do not need to change how they call eth_getLogs, and applications do not need to be rewritten.
The improvement happens entirely at the client level. Once enabled, existing queries simply run faster.
Log Index adds a new storage layer on top of RocksDB, along with small RPC-level changes that allow log queries to be handled more efficiently.Once enabled, it operates largely independently and incrementally, indexing logs as receipts are becoming available.At the moment, Log Index is disabled by default and must be explicitly enabled. It is treated as an opt-in capability rather than a default configuration.
The impact of Log Index depends on both queried block range and event density. For small block ranges, the difference is modest.
Log Index provides the most benefit when querying large portions of the chain where relevant events are sparse. This includes full-history scans or queries spanning hundreds of thousands to millions of blocks. In these cases, traditional eth_getLogs queries spend most of their time scanning blocks that do not contain relevant events.
Log Index changes how the client narrows the search space for a given eth_getLogs query.Rather than evaluating every block in a large range, the client first uses indexed data for addresses and topics from the query filter to determine a much smaller sequence of block numbers that are likely to contain relevant events.
eth_getLogs queries
Benchmarks were run against the same node configuration before and after enabling Log Index, using identical request sets.
All requests were executed with a 5-minute timeout, which was explicitly increased for benchmarking purposes. On default node settings (≈20 seconds), many large-range eth_getLogs queries would time out well before completion.
The benchmark suite consisted of 12,000 total RPC requests, of which 1,561 were eth_getLogs calls. Requests were run against the same node twice: first with Log Index disabled, then with it enabled, to isolate the impact of indexing on query performance. Execution times include some network latency for the benchmark table below. The locally executed benchmarks, used for the charts later in this section, exclude network latency. As a result, reported execution times in the table may slightly overstate pure client-side execution time.
For transparency and reproducibility, the full benchmark request set is available as a CSV.
→ View the benchmark request set (CSV)
Across the benchmark set, Log Index significantly reduced tail latency for eth_getLogs queries:
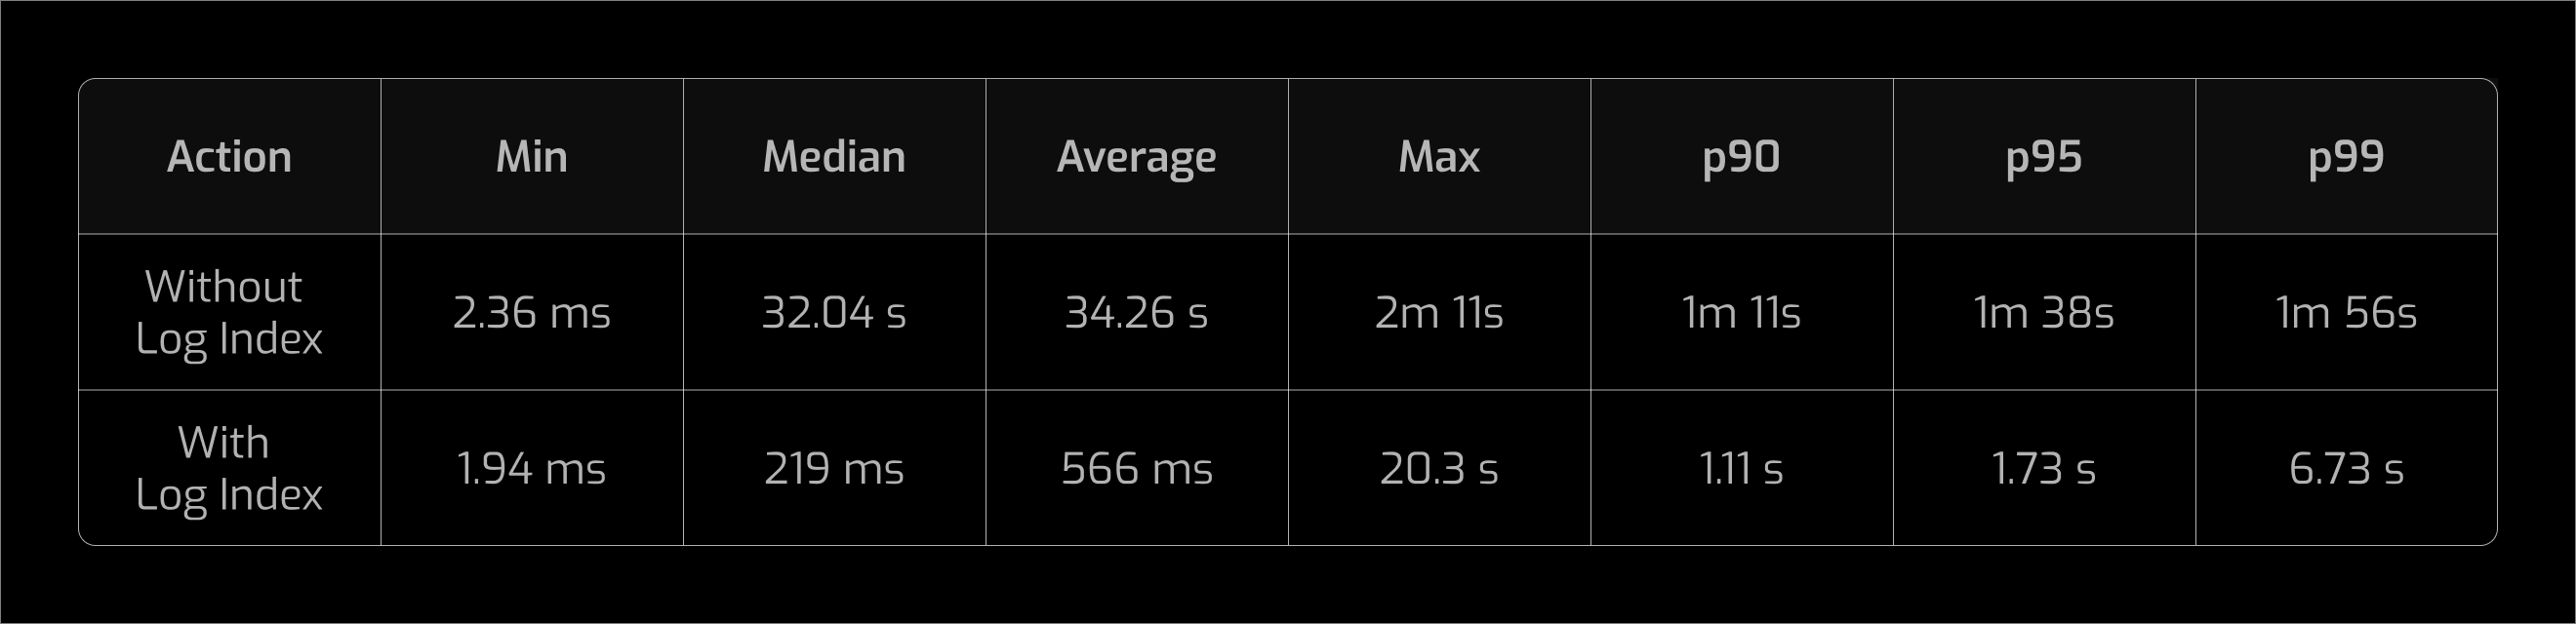
The most meaningful improvements appear in the median and tail latencies, where long-running queries are reduced from tens of seconds or minutes to seconds.
Log Index is not a universal speed-up. It provides little benefit for:
In these cases, query time is dominated by block reads and data transfer rather than log discovery. Log Index does not store logs directly; it stores mappings from addresses and topics to block numbers. When a query returns very large result sets or spans dense activity, the number of blocks that still need to be fetched and scanned remains high, limiting the benefit of indexing.
To illustrate how query performance scales, we measured execution time as the queried block range increases across several real-world use cases.
In this scenario, execution time without Log Index grows rapidly as block range increases. With Log Index enabled, execution time remains low even as the range expands into millions of blocks.
.png)
Log Index still provides a substantial speed-up, though the relative improvement is smaller than in the ideal sparse-address case.
.png)
Here, execution time improves with Log Index, but the gap narrows as block range increases. When many blocks contain matching events and large volumes of data must be fetched and serialized, performance becomes dominated by block reads and data transfer rather than log discovery.
No. Log Index builds on top of data the node already has and does not require a full resync. Once enabled, it begins indexing logs incrementally without disrupting normal operation.
Log Index is most relevant for teams that depend on log-heavy data access.
Teams care whether their queries work, not how nodes store data internally.
Log Index makes previously slow or unstable queries fast and predictable. It allows teams to access full historical event data without timeouts, manual batching, or fragile infrastructure workarounds.
Nothing about application code needs to change. The improvement happens at the client level and benefits everything built on top of it.
For systems that rely on historical event data, this is the difference between something that is technically possible and something that is operationally viable.
No. Log Index is currently disabled by default and must be explicitly enabled. It is positioned as an opt-in capability rather than a standard configuration.
Log Index requires approximately 30 GB of additional storage for Ethereum mainnet. On Gnosis Chain, the additional storage requirement is approximately 43 GB. It can be enabled with a single configuration flag:
--LogIndex.Enabled true
Indexing happens in the background and does not block initial sync. However, it may periodically use IO and CPU resources, and index building typically completes within a few hours after the initial sync finishes.
For detailed implementation specifics, see the related pull request.
Log Index follows the same philosophy as Nethermind’s broader performance and reliability efforts. Instead of introducing new abstractions, it strengthens the foundations that existing systems rely on.
Earlier work focused on block processing speed and client performance. Log Index applies that same discipline to data access, improving how quickly and reliably information can be extracted from the chain.
Log Index is part of a broader effort to make Ethereum clients faster, more predictable, and safer under load.
Related work includes the Gas Benchmarking Framework, a shared methodology now used across execution clients and Ethereum Foundation research groups to measure worst-case execution performance and network readiness as Ethereum scales.
→ Measuring Ethereum’s Execution Limits: The Gas Benchmarking Framework
The next step is broader benchmarking across production workloads. As more data becomes available, the team will evaluate whether Log Index should be enabled by default.
For teams already running large-scale eth_getLogs queries, Log Index is available today as an opt-in capability worth testing.
The Leading Engineers of Blockchain Infrastructure
Nethermind © 2026
.svg)
.svg)

.svg)

.svg)
.svg)


.svg)
.svg)
.svg)
.svg)


.svg)